More Images 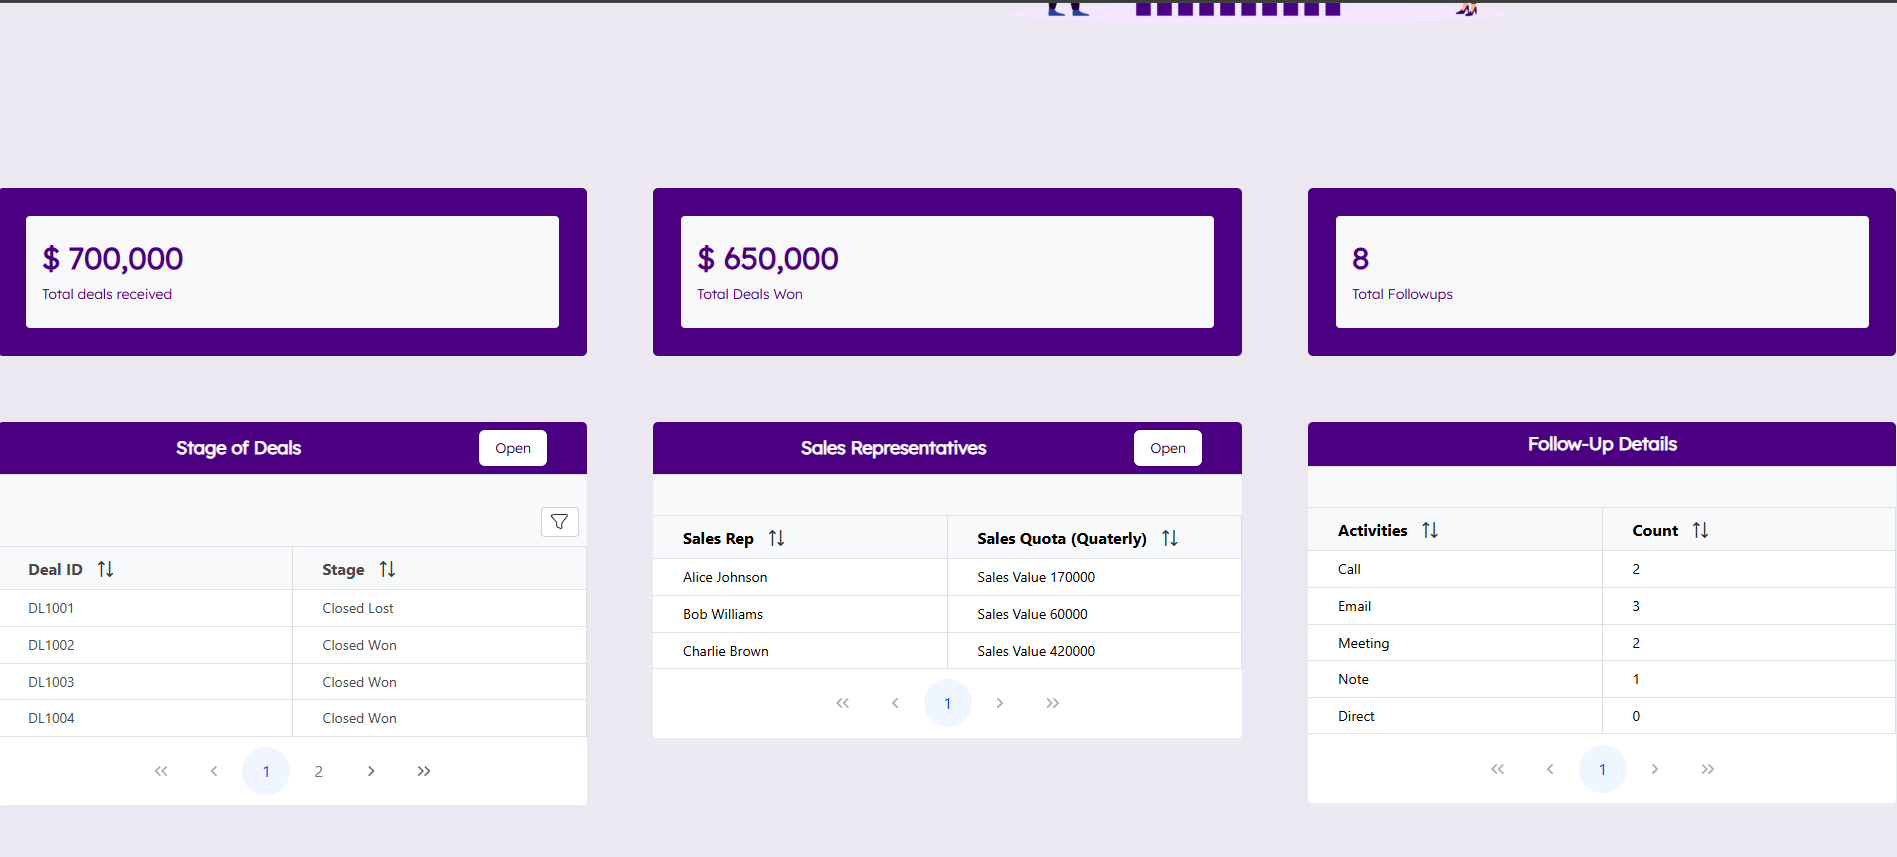
Sales Pipeline Tracker
CATEGORY
sales-crmPRICING
FreeData Source
SUMMARY
Free sales pipeline tracker template for Google Sheets. Track leads, manage deal stages, and analyze your sales performance instantly.
Description
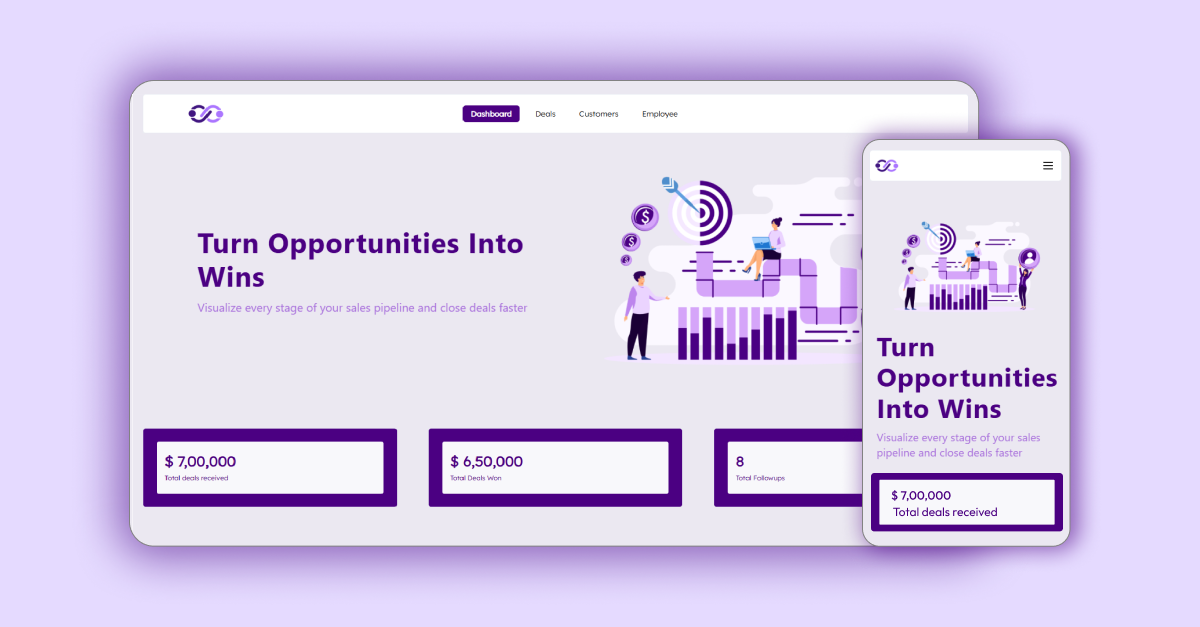
Sales Pipeline Dashboard Template
Overview
This Sales Dashboard Template lets you analyze, Track, and optimize your Raw Sales Data in Google Sheets from a Fully Functional Dashboard. This Template provides an extensive Visual Representation of the key sales metrics and enables you to be informed about your Sales Data, and helps you to make effective decisions on sales.
Why Sales KPIs Dashboard Matters?
A Sales KPIs Dashboard template is not simply a reporting one; it helps businesses stay on course and move toward their goals. By converting scattered sales data into meaningful insights, it empowers teams to monitor progress, identify trends, and make smarter decisions. Its real value comes from offering a unified, real-time snapshot of sales performance, ensuring leaders stay aligned with targets and can act quickly to boost growth.
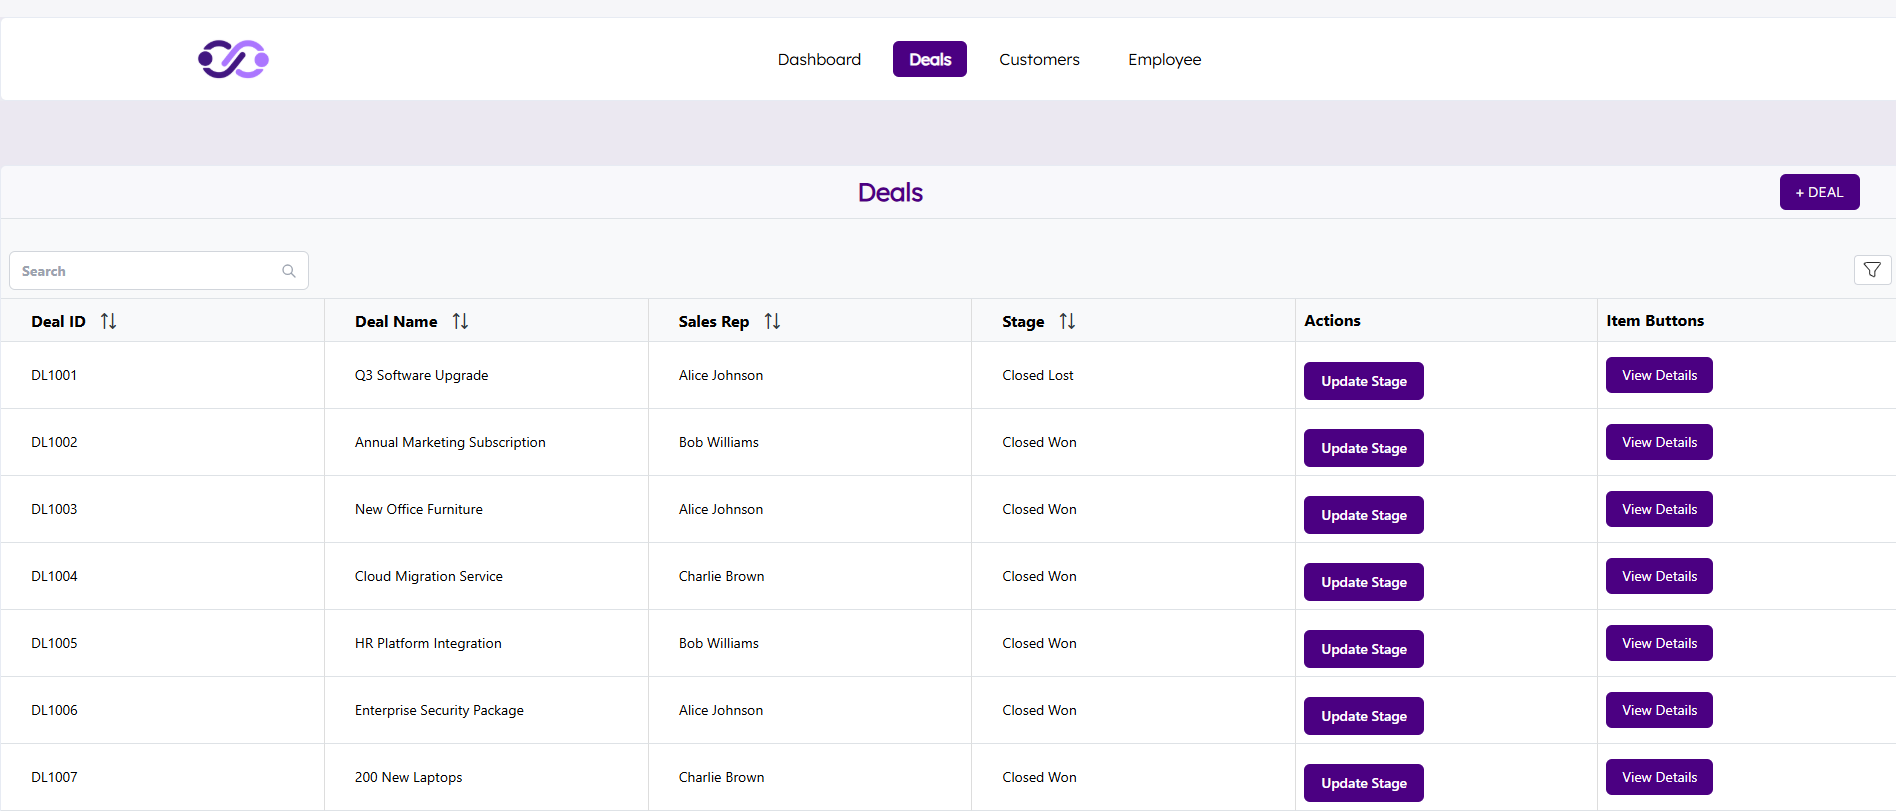
- Gain Complete Visibility: Sales pipeline dashboard Template gives you a structured, all-in-one view of your sales pipeline. Track every deal in motion, including its stage, assigned salesperson, performance metrics, pricing details, projected close dates, and more.
- Real-Time Performance Tracking: This sales KPIs dashboard template offers a centralized location for all crucial sales metrics, providing a clear and immediate overview of performance. This real-time visibility allows sales leaders and teams to monitor progress against targets, identify trends as they emerge, and spot potential issues before they escalate.
- Enhance Organizational Collaboration: Effective sales teams achieve greater success by sharing knowledge and best practices. This sales pipeline dashboard template streamlines collaboration, minimizes operational friction, and ensures teams remain focused on their primary objective, i.e, closing deals successfully.
- Get Meaningful Data Insights: The template provides a clear, data-backed view of sales performance, enabling accurate conversion rate calculations, reliable forecasting, and stronger business growth throughout the sales funnel.
- Automated Data Updates: Automated data updates are the backbone of a dynamic and effective sales dashboard, transforming it from a static report into a real-time one. This functionality eliminates the need for manual data entry and ensures that the information displayed is always current, accurate, and ready to inform critical business decisions.
Who Can Use This Sales Pipeline Template?
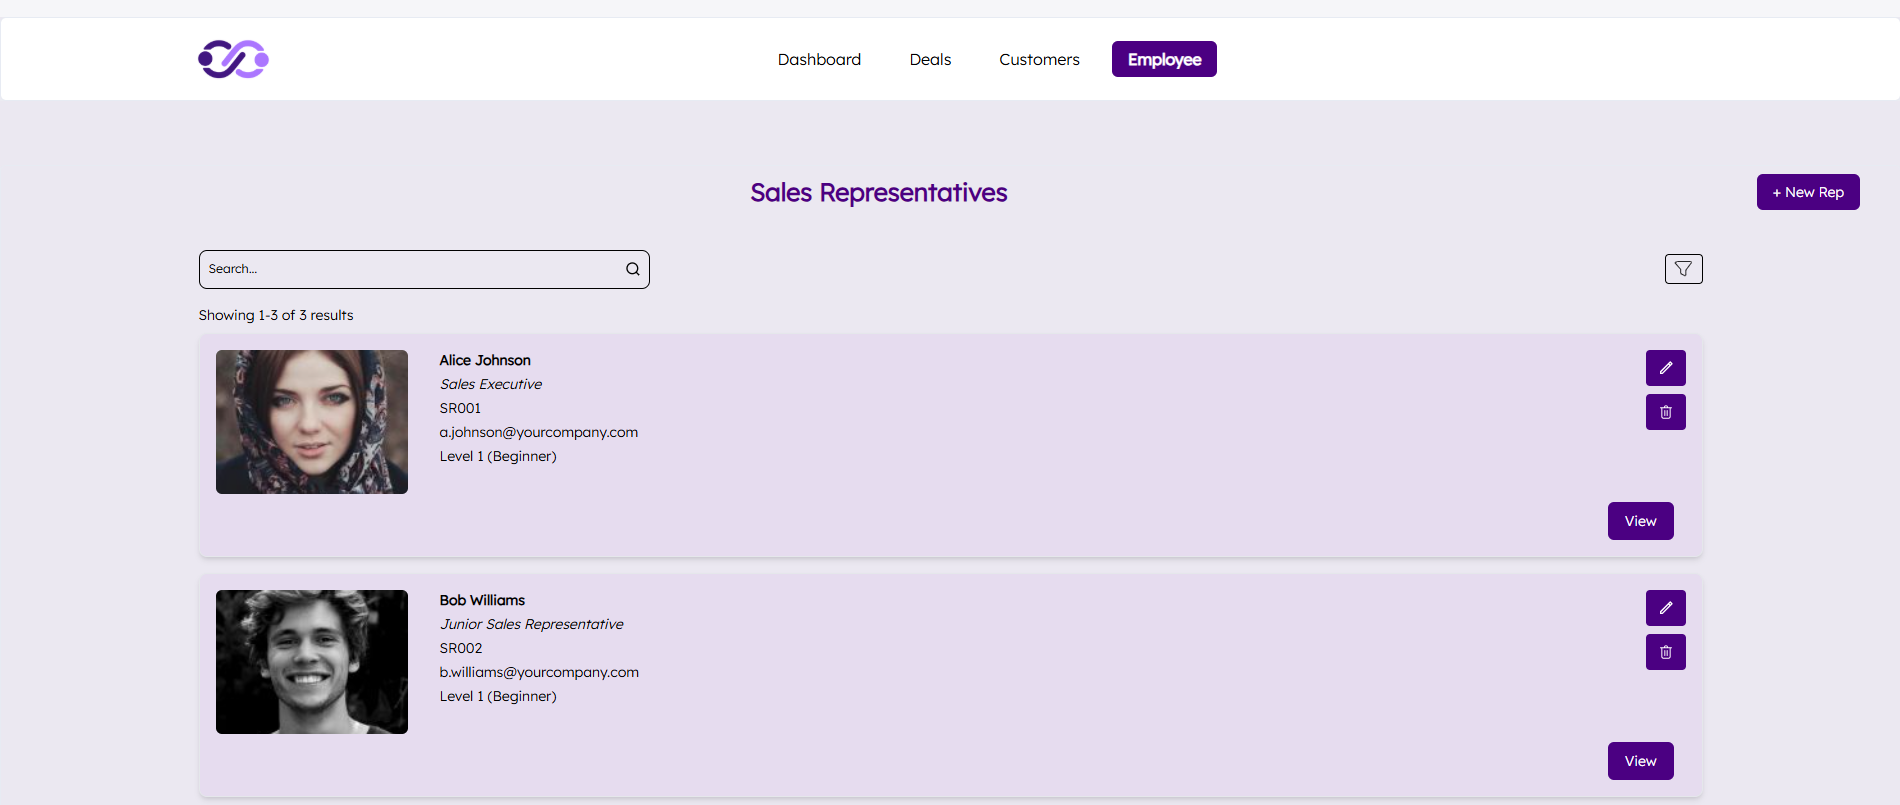
This template is designed for all team members involved in the sales process, including sales representatives, managers, and team leads. It serves as a centralized pipeline tracker, ensuring that everyone has access to the same real-time sales information.
- Sales Representatives: Easily track leads, manage opportunities, and stay organized throughout every stage of the sales cycle. The template helps reps save time on manual updates so they can focus more on closing deals.
- Sales Managers: Monitor team performance in real time and quickly identify bottlenecks in the pipeline. Use the insights to coach team members, improve efficiency, and drive consistent results.
- Team Leads: Ensure smooth deal flow across the pipeline and foster stronger collaboration within the team. The shared access keeps everyone aligned and working toward the same objectives.
- Business Development Teams: Capture, nurture, and prioritize prospects effectively to build a healthy pipeline. The template provides clarity on which opportunities have the highest growth potential.
- Executives: Gain high-level visibility into sales performance with reliable data-driven insights. Use accurate forecasts to make better strategic decisions and guide long-term growth.
Features of this Template
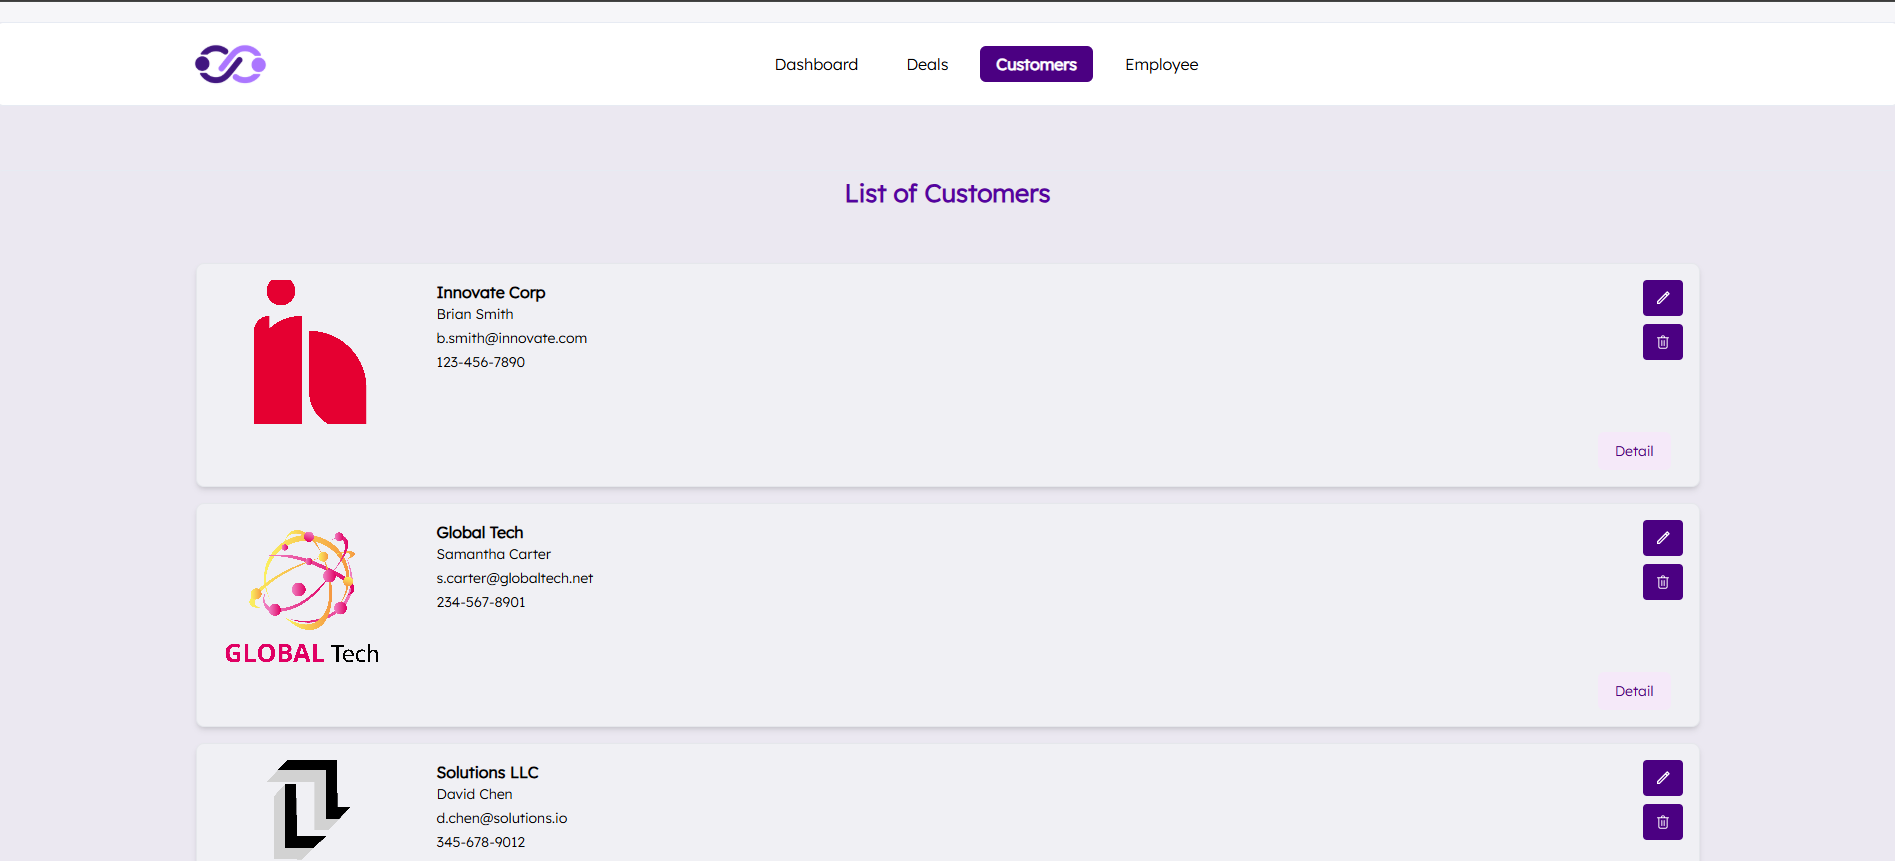
1. Lead and Prospect Management
- Easily capture, organize, and manage potential customers. Track progress from first contact to successful conversion.
2. Field Sales and Activity Tracking
- Monitor field activities and on-the-go sales interactions. Ensure every effort is recorded and aligned with goals.
3. Sales Process and Performance
- Gain visibility into each stage of the sales cycle. Evaluate performance to identify strengths and areas for improvement.
4. Proposal Management
- Simplify the creation and tracking of proposals. Follow up efficiently to move deals forward faster.
5. Real-Time Sync with Google Sheets
- Keep your sales data always up to date. Enable seamless collaboration and transparency across your team.
Analytics
Turn raw sales numbers into actionable insights. Improve forecasting and drive smarter decision-making.
Frequently Asked Questions on Sales Dashboard Templates
1. What is the Sales Pipeline Dashboard Template?
It is a comprehensive template for Google Sheets designed to help you analyze, track, and optimize your raw sales data. It provides a visual, all-in-one dashboard of your key sales metrics to help you make informed business decisions.
2. Why is a sales KPIs dashboard important?
A sales KPIs dashboard is crucial because it converts scattered sales data into meaningful, actionable insights. It helps teams monitor progress against goals, identify trends, make smarter decisions, and stay aligned on targets to boost growth.
3. How does the template help with visibility into the sales pipeline?
The template provides a structured, complete view of your entire sales pipeline. You can track every deal, including its current stage, the assigned salesperson, performance metrics, pricing, and projected close dates.
4. How are data updates handled? Is it manual?
No, data updates are automated. The template features real-time synchronization with Google Sheets. When you update your raw sales data in the connected Google Sheet, the dashboard automatically reflects these changes, eliminating the need for manual data entry.
5. How does sales KPIs dashboard enhance team collaboration?
By providing a single, centralized source of real-time sales information, the template ensures everyone is on the same page. This shared visibility streamlines collaboration, reduces operational friction, and keeps the team focused on closing deals.
6. What software do I need to use this template?
This is a Google Sheets template, so all you need is a Google account to access and use it. No other special software is required.
Other Templates You Might Like
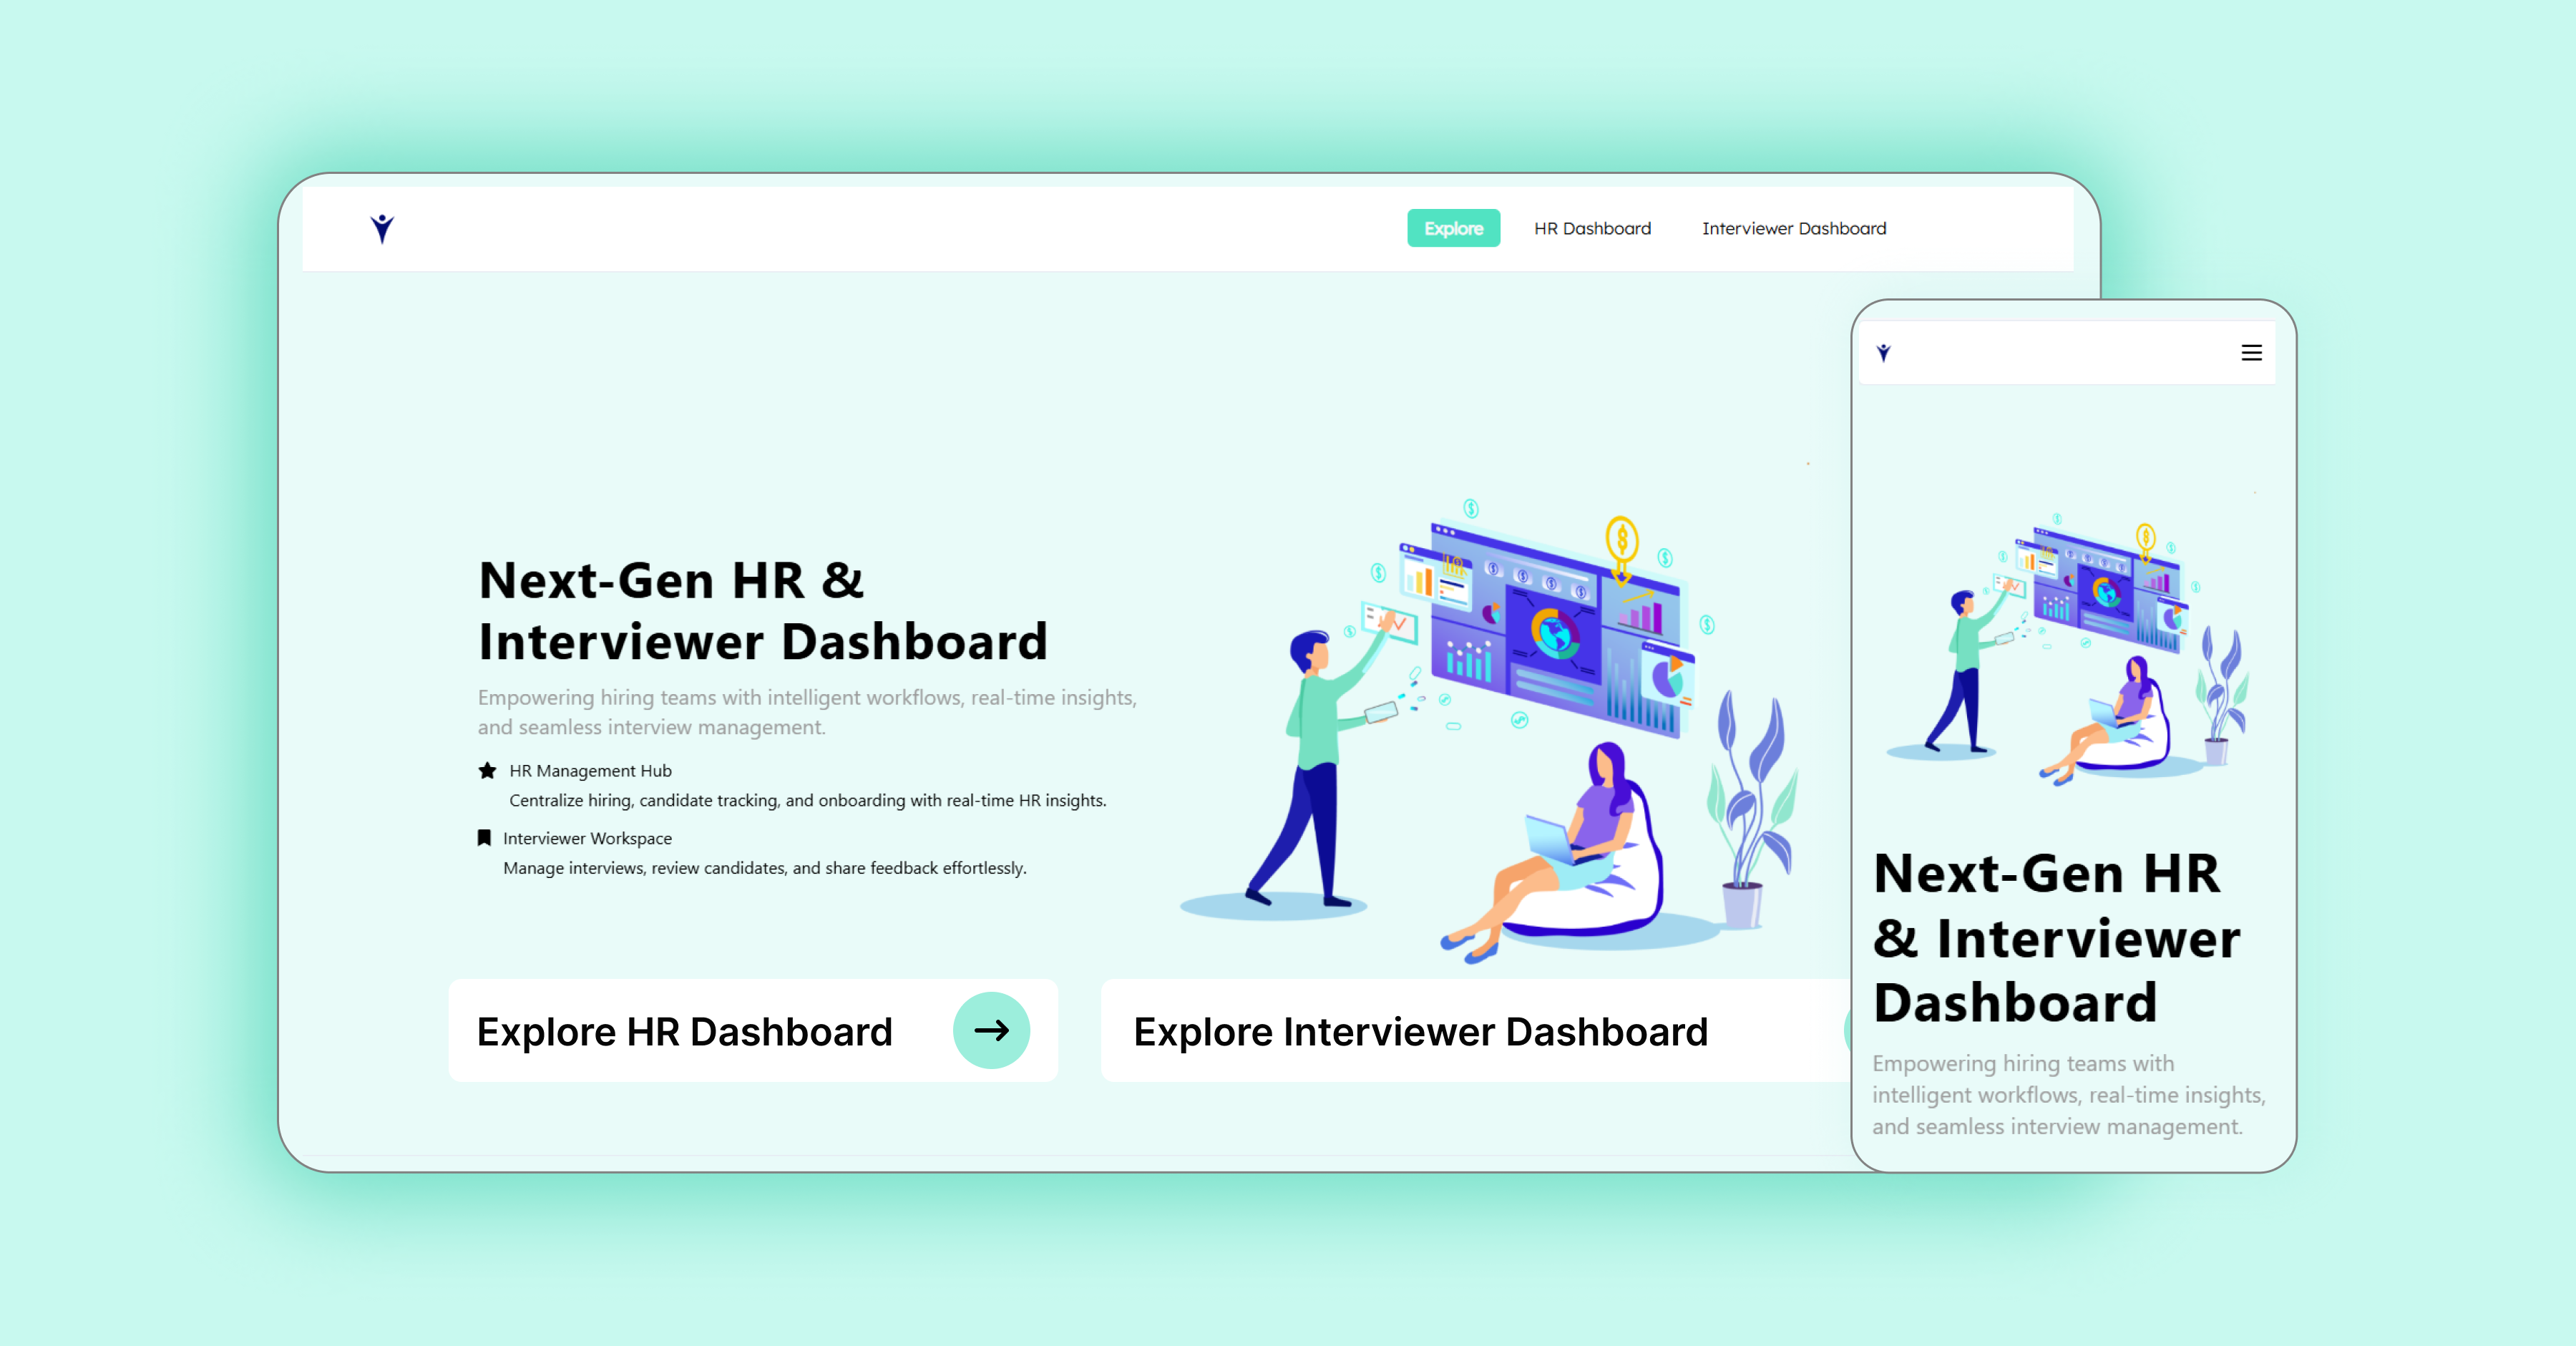
HR Recruitment Dashboard
hr-hiring-teams
Free
ChartApps is a dashboard and app builder based on Google Sheets. It's designed to be simple and easy to use.

